You’ve built a shiny new generative AI application on AWS. It answers questions, summarizes documents, performs autonomous tasks or workflows, maybe even writes code. But here’s the thing — how do you know it’s actually working well? Is it giving accurate answers? Is it costing you a fortune? Is it slow for some users?
That’s where observability comes in.
What Is Observability, and Why Should You Care?
Observability simply refers to the ability to monitor and understand what is occurring within your system.
For traditional apps, this means tracking errors, response times, and server health. For generative AI apps, it goes further:
– Are the model’s responses actually good and relevant?
– How long does each request take?
– How much is each API call costing you?
– Are users hitting errors or getting blocked by safety guardrails?
– Is the model hallucinating (making stuff up)?
Without observability, you’re flying blind. You won’t know something is broken until a user complains — or worse, until bad outputs cause real damage.
The Unique Challenges of Observing GenAI
Generative AI apps aren’t like regular software. They bring a few new headaches:
– Non-deterministic outputs — The same prompt can produce different answers every time. You can’t just write a unit test that checks for one correct response.
– Complex chains — Many apps use multi-step workflows. For example, they might retrieve documents, build a prompt, call a model, and then post-process the result. A failure at any step can silently degrade
quality.
– Cost unpredictability — Token usage directly impacts your bill. A poorly written prompt can burn through tokens fast.
– Safety and compliance — You need to know if the model is producing harmful, biased, or off-
topic content.
The Key Pillars of GenAI Observability
Think of observability as resting on four pillars:
1. Traces
Track a single request as it moves through your entire system. Follow it from the user’s question, through retrieval, prompt construction, and model invocation, and back. This helps you pinpoint exactly where things slow down or break.
2. Metrics
Track the numbers that matter:
– Latency (how fast is the response?)
– Token usage (input and output tokens per request)
– Error rates
– Throttling and rate limits
– Cost per invocation
3. Logs
Capture the details — what prompt was sent, what response came back, what context was
retrieved. Logs are your forensic tool when something goes wrong.
4. Evaluation
This is the GenAI-specific pillar. You need to measure output quality:
– Relevance — Did the answer address the question?
– Faithfulness — Is the answer grounded in the provided context, or is it hallucinated?
– Toxicity and safety — Is the output appropriate?
How AWS Helps You Build This
AWS offers several services that fit together to give you full observability over your GenAI workloads.
Amazon Bedrock — Built-in Observability Features
If you’re using Amazon Bedrock to access foundation models, you get some observability out of the box:
– Model invocation logging — Turn this on to capture every prompt and response. You can send these logs to Amazon S3 or CloudWatch Logs for analysis.
– CloudWatch metrics — Bedrock automatically publishes metrics like invocation count, latency, and errors.
– Guardrails — Bedrock Guardrails let you define safety policies and track how often content gets filtered or blocked.
Amazon CloudWatch
CloudWatch is the central hub for metrics, logs, and alarms on AWS:
– Set up dashboards to visualize model latency, error rates, and token consumption in real time.
– Create alarms that notify you when latency spikes or error rates cross a threshold.
– Use CloudWatch Logs Insights to query your invocation logs. For example, find all requests where the model took longer than 5 seconds.
AWS X-Ray
X-Ray gives you distributed tracing. If your app has multiple steps (retrieve from a knowledge base, call a model, call another model for summarization), X-Ray shows you the full journey of each request and where time is being spent.
Amazon S3 + Athena
For long-term analysis, store your invocation logs in S3 and query them with Athena. This is great for:
– Analyzing cost trends over weeks or months
– Finding patterns in low-quality responses
– Building datasets for fine-tuning or evaluation
Amazon Bedrock Evaluations
Bedrock provides built-in model evaluation capabilities that let you assess output quality using both automatic metrics and human review. You can measure things like accuracy, robustness, and toxicity without building your own evaluation pipeline from scratch.
Open-Source Integrations
AWS also plays well with popular open-source observability tools for GenAI:
– OpenTelemetry — Instrument your application code to emit traces and metrics in a vendor-neutral format. AWS Distro for OpenTelemetry (ADOT) makes this easy.
– LangSmith / LangFuse — If you’re using LangChain, these tools plug in to give you prompt-level tracing and evaluation.
A Practical Architecture
Here’s what a well-observed GenAI setup on AWS might look like:
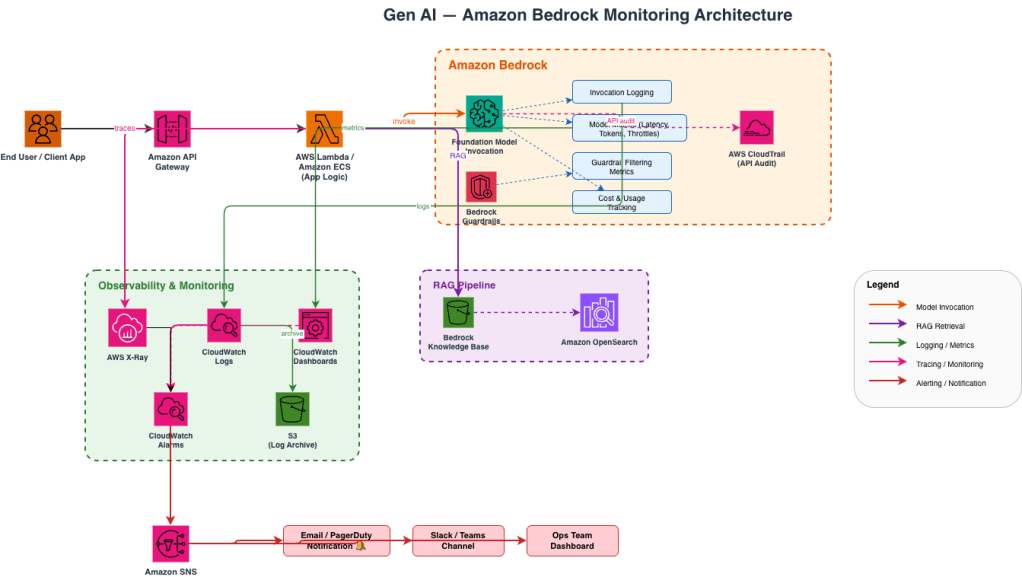
Image 1: Generative AI Monitoring Architecture
Getting Started — A Simple Checklist
If you’re just starting out, here’s a no-nonsense checklist:
1. Turn on model invocation logging in Amazon Bedrock. Send logs to both CloudWatch and S3.
2. Set up a CloudWatch dashboard with key metrics: invocation count, latency (p50, p90, p99), errors, and token usage.
3. Enable X-Ray tracing in your application to see the full request lifecycle.
4. Create CloudWatch alarms for latency spikes and elevated error rates.
5. Enable Bedrock Guardrails if your app is user-facing, and monitor the filtering metrics.
6. Schedule periodic evaluations using Bedrock’s evaluation tools or your own test datasets.
7. Review costs weekly using token usage logs stored in S3, queried via Athena.
Final Thoughts
Generative AI is powerful, but it’s also unpredictable. The models can be brilliant one moment and confidently wrong the next. Observability is essential. It helps you build trust in your AI system. It lets you catch problems early. It also keeps costs under control. The good news is that AWS gives you the building blocks. You don’t need to build an observability platform from scratch. Turn on the logging, set up the dashboards, trace your requests, and evaluate your outputs. Start simple, then layer on more sophistication as your application matures.
Your AI is only as reliable as your ability to watch it.
